Hyper-monetization reloaded: Another round of bubble talk
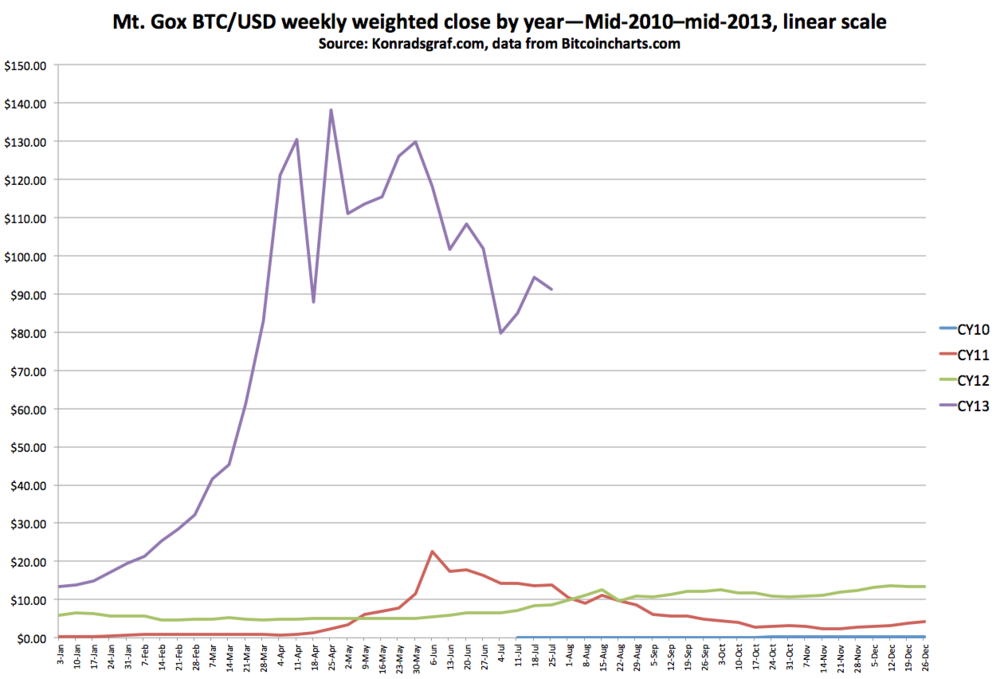
/‘Tis the season again when the Bitcoin exchange rate rises fast and “bubble” talk resumes among some journalistic and other Bitcoin skeptics. Around the height of the previous most dramatic Bitcoin exchange rate movements of March and April 2013, I posted an article called “Hyper-monetization: Questioning the ‘Bitcoin bubble’ bubble,” which was widely circulated at the time and still referenced now. What follows is a blend of brand-new material and thoroughly revised highlights from the earlier article.
The objective was, and is, not to give advice or make predictions, but to draw on theory to develop alternative perspectives on what exactly a “bubble” may or may not be in relation to the distinctive case of a brand-new rising-value medium of exchange. “Medium of exchange” is fancy economic jargon for something one can pay for goods and services with. I define a money as the common unit of pricing and accounting in a given context (see my “Bitcoin as medium of exchange now and unit of account later: The inverse of Koning’s medieval coins,” 14 September 2013).
Behind popular price-bubble discourse often lies a thinly or not-at-all veiled general debate on whether Bitcoin is a valid system. Some degree of bubble-talk functions as a pop proxy for this. In April, some Bitcoin critics were citing rapid price movements in support of the contention that Bitcoin, as such, was only a bubble. When this bubble popped, the story went, Bitcoin units would supposedly return to their “inherent” value, which they claimed to be…nothing.
Of course, Bitcoin failed to oblige them once again. Yet each time Bitcoin does not fulfill this pop empirical prediction, and instead eventually goes much higher in price later on, one nevertheless hears the same prediction repeated the next time around. In contrast, there are several ways to take a much longer-term view, one that is able to both account for price manias and also acknowledge the possibility that Bitcoin could be a valid system, and an ever more reliable one in the making.
Hyper-monetization reloaded
Many observers have likened the rise of Bitcoin to an asset bubble. Another less common word introduced in this context is hyper-deflation. Some say such a thing is horrible, others that it is great. I suggest a quite different interpretive concept to apply in addition: hyper-monetization.
I came across the term hyper-deflation, intended in a positive sense of rapidly rising value, when Bitcoin’s exchange rate was climbing fast from the low thirties to the high thirties over a few days in early March 2013. While a few specialists of a certain persuasion understand “deflation” to be a great thing for ordinary people, the word still has major problems. It has several possible definitions. It can refer to price-level changes or to quantity of money changes, depending on who is talking or when. It is assigned a quite negative interpretation in most conventional economics circles. Finally, it has a general public-relations problem. It just sounds depressing as a word. Whatever its real net effects on society might be, “deflation” just sounds like a bad thing no matter what. Which child most wants a deflated balloon?
The word hyper-monetization occurred to me as a more positive alternative to hyper-deflation, one that also provides an antonym to the catastrophic hyper-inflations that have repeatedly killed off fiat paper monies throughout history. The exact opposite of the death of an old money at the debt-dripping hands of state/bank alliance managers would be the birth of a new medium of exchange at the creative hands of the market.
The term de-monetization denotes the more general concept of a widely used medium of exchange ceasing to function as one. A total hyper-inflationary collapse is one way this can happen. Another is bimetallist legal-tender price-fixing schemes driving one precious metal, say silver, out of circulation in favor of another, say gold, or vice versa. Yet another historical example is when a pure fiat paper standard is created after monetary authorities permanently “suspend redemption” of legal tender notes into the precious metals that had been promised in exchange for such notes (that is, note-issuer default is “legalized”). Paper and account entries then remain as money, while the metals that had formerly “backed” them are de-monetized and trade as commodity assets, bought and sold in terms of what replaced them in the actual role of money. The rhetorical line from some well-meaning sound-money promoters that “gold is money” is simply untrue, except, of course, in regard to those times and places where it actually was.
The opposite process, “monetization” in this sense, denotes something that was not a money beginning to function as one. When euros took over the jobs of various European national currencies, euros were monetized and the previous national currencies de-monetized. The French franc and Italian lira do not now function as monies; they are historical relics.
Something that gains its own exchange value from scratch on the open market contrasts sharply with any such forced legal conversions. When a freely chosen unit monetizes through market processes, and does so quite rapidly, it might then reasonably be described as being in a process of “hyper-monetization” (for a detailed treatment of origin-of-money issues, see my recent paper, “On the origins of Bitcoin: Stages of monetary evolution,” revised version, 3 November 2013, PDF).
A problem with the “bubble” bubble
Bitcoin’s high price volatility is unquestioned. However, it is unsurprising for at least two reasons. First, it is not widely understood as a technology and is in a very early stage of development. Second, its exchange value (market price) tends to react to news that highlights regime uncertainty. It should be noted that this is a type of “government failure” in that the scope and variability of policy uncertainty across multiple jurisdictions greatly increases market uncertainty.
Something else to consider in relation to the eternally-recurring “Bitcoin is a bubble” claim is that in a normal asset bubble, certain key factors differ. To whichever height the prices of typical bubble assets such as houses climb, a given house remains the same good in a physical sense as when it exchanged for less money. In the case of a monetization event, in contrast, the actual utility of the trading unit—which is mainly its utility as a trading unit—may actually rise. This is due to monetary network effects, named in reference to the value that comes from the extent of the network of people willing and able to deal in a particular trading unit.
To imagine how this special case of medium-of-exchange utility growth might differ from an ordinary asset bubble in, for example, housing, it would be as if not only the prices of houses were rising during a buying rush, but in addition, their actual sought-after qualities as physical houses were improving as well. Such fantastic houses might sprout new rooms with no one building them. New paint jobs might appear mysteriously overnight without any painters having visited.
For a medium of exchange, a rising general usability for facilitating the purchase of goods and services (separate from the relative value of each unit) is not directly tied to its exchange rate against other monetary units. Still, this aspect is likely to positively influence such exchange rates. Conversely, rising exchange rates, if they generate news and wider attention, can then lead to enhanced network effects through increased recognition, creating a network-growth cycle.
For those who have been following Bitcoin news closely, for months on end there have been seemingly daily announcements of new ways and places for consumers to spend bitcoins, new or improved wallet services to manage bitcoins, new or improved payment processor services to receive bitcoins, and new exchanges at which to buy and sell bitcoins—all on a global basis. Bitcoin payment processor BitPay announced in September that it had 10,000 merchant customers, up 10x from 1,000 a year earlier. In the past 12 months, the number of wallet accounts listed at the popular Blockchain.info My Wallet service has risen 13.9x from 38,460 to 534,575. These are just two specific services and do not reflect horizontal expansion in the number of competing services or the direct use of the Bitcoin network to facilitate transactions on the part of consumers and merchants using directly controlled software without intermediated assistance from service companies.
“Is” a bubble versus “is in” a bubble phase
Bitcoin does have its manias and crashes. The hyper-monetization concept seems useful especially in a longer-term perspective for addressing the view that Bitcoin is nothing more than a speculative bubble. The most insistent proponents of this view elaborate along these lines: “Bitcoin has no ‘intrinsic’ value and is therefore ultimately destined to fall to its ‘inherent’ value, which is zero.
However, claiming that Bitcoin is a bubble (total dismissal of the system as such) is quite different from claiming, perhaps helpfully, that Bitcoin’s exchange rate may be showing signs of being in a temporary bubble phase or mania at a given point in time. That said, every significant rise in price cannot just be reflexively attributed to a mania. There is certainly more to this story and there are many specific matters of degree and interpretation. Among these is recognizing that a young currency such as this would naturally vary in price quite a bit more as it is being discovered in waves than later after it has gained more widespread adoption.
At a theoretical level, unlike a simple asset bubble mania, the more people begin using or expanding their use of a particular medium of exchange, the more its actual utility rises, and the more valuable it actually is in this function from the point of view of its users. The exchange value of a medium of exchange unit is related to, among other things, each holder’s expectations of being able to use the unit in future exchanges. How many people will accept the unit, how readily, and for what?
At least when it comes to the aspect of monetary network-effect growth in any season, ‘tis the more the merrier.